
It is extremely difficult to collect data about bullying. Research on any topic can be expensive to fund. One has to consider things like paying researchers to collect data, getting people into the schools to talk to students, and putting all of the information together over time. Every two years, the Centers for Disease Control (CDC) publishes a health-related survey of our nation’s youth. For the 2017 Youth Risk Behavioral Surveillance (YRBS), almost 15,000 surveys were completed from 144 schools around the country. Since 1991 the CDC has collected data from more than 4.5 million high school students (Grades 9-12). The YRBS monitors six categories of health-related behaviors among youth and young adults that are known to contribute to death and disability:
- Behaviors that contribute to unintentional injury and violence
- Tobacco use
- Alcohol and other drug use
- Sexual behaviors related to unintentional pregnancy and sexually transmitted infections
- Unhealthy dietary behaviors, and
- Physical inactivity
The first category the YRBS measures—Behaviors that contribute to unintentional injury and violence—includes categories like “Carried a weapon,” “Carried a weapon on school property,” or “Were in a physical fight.” These categories ask students about their personal experiences, and are kept completely anaonymous. Also measured under this category is Bullying. Students were asked specifically if they “were electronically bullied,” or “bullied on school property” in the 12 months prior to the survey.
Bullying and the YRBS
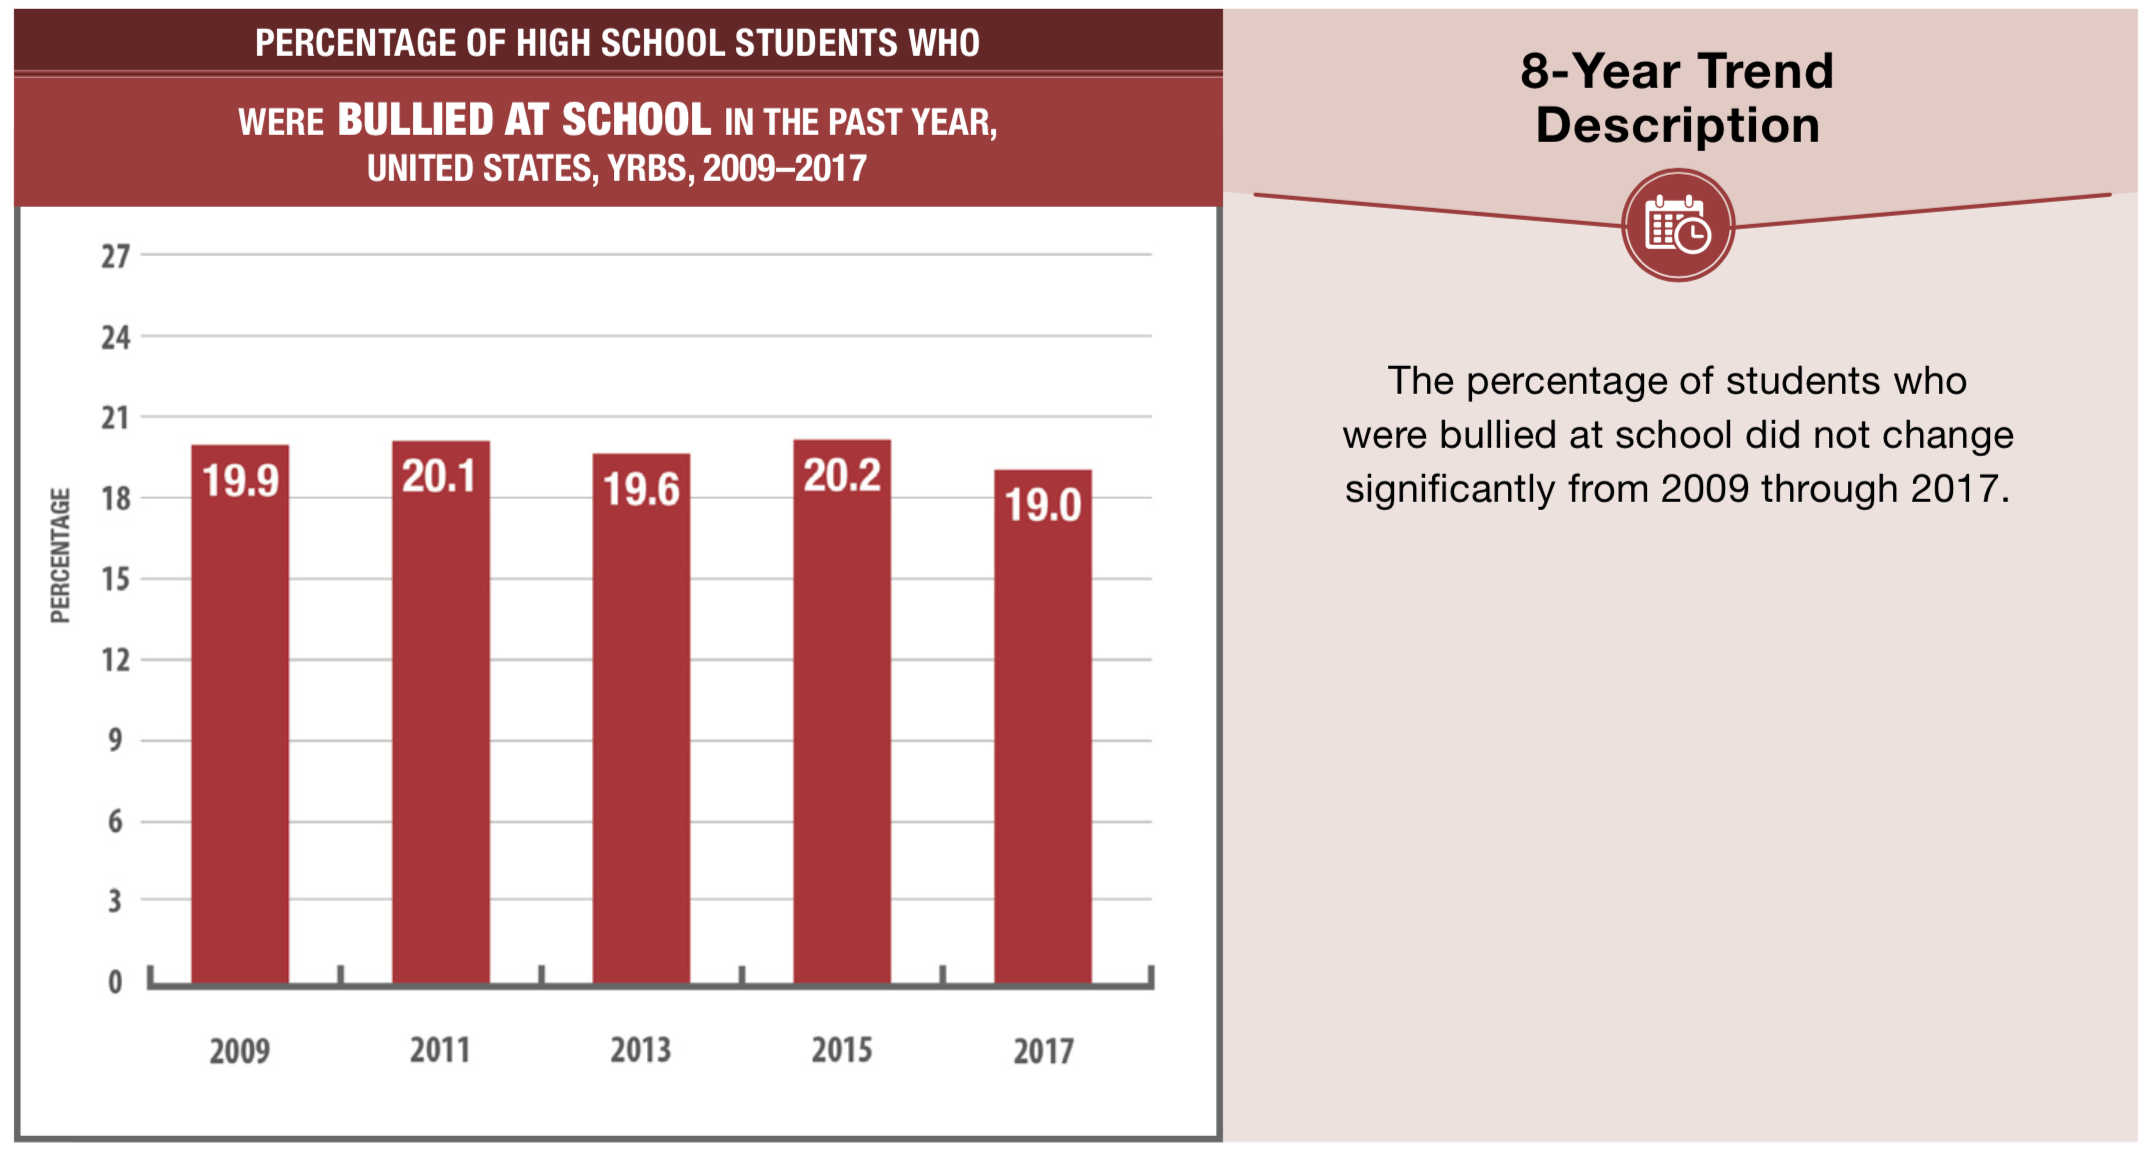
Bullying is intentional acts of aggression that are directed at a person of lesser power and repeated over time. Nationwide, 19.0% of students report being bullied on school property during the 12 months before the survey. This number seemed high to me when I first saw it. 1 out of 5 students experiencing bullying seemed so high that I wanted to check and see if the climate for bullying had become worse or better over the years. Turns out, the last 10 years of YRBS indicate that things have not changed much. In 2009 19.9% of students reported being bullied. In 2013, it was 19.6%. Given that rates of bullying have not changed much in the last 10 years, according to the data, I was surprised. The reason for my surprise is that bullying is a topic that is getting more and more attention from all angles, and I would expect that rates of bullying would be decreasing with all of the attention.
How come rates of bullying do not seem to have changed?
Maybe what is happening is that as we are all becoming more aware of what bullying looks like, we are able to better “see” it when it happens. Our efforts to combat bullying are not being done in vein. But as fast as we are combating bullying, we are understanding that interactions between young people that we once thought were “normal,” are, in fact, bullying. Additionally, people who research bullying are learning how to ask the right questions for students to accurately report their experiences in schools. And maybe teachers are better spotting these behaviors in the moment.
So, when I look at the YRBS, and the last 10-years of bullying data that indicate that rates of bullying “have not changed,” I see the people who want to combat bullying asking the right questions to better assess bullying behavior and developing interventions that are working for young people around the country. I see students, teachers, and parents bringing the conversation about bullying out into the open, and giving everyone the opportunity to engage in school safely and free from the threat of bullying. I am hopeful that the next 10-years will bring better tools and better interventions to stop bullying. I am hopeful that young people will learn to stand up for those who are isolated and lonely. And I am hopeful that we will continue to identify the needs of those individuals in our community who would benefit from kindness.


2 thoughts on “Bullying in our schools – Data from the CDC”
Pingback: Stand 4 Kind - bullying prevention- 10-Tips to stop bullying in its tracts -
Pingback: Alcohol Prevention Tips for Parents - Stand 4 Kind Prevention